Monday, May 30, 2011

Indy 500 and Risk Management

Yesterday's Indianapolis 500 race was a reminder about the importance of risk management -- and weighing the risks versus the returns of every action and trade. The leader of the race with one turn to go crashed -- and lost the race -- due to one lapse in judgment.


INDIANAPOLIS – One turn. One stinkin’ turn.
JR Hildebrand made it through 799 of ’em without any trouble. As the young Californian approached that final left, all he had to do was keep his car off the wall, speed down the main straightaway and collect a win in the Indianapolis 500 on his very first try.
Instead, Hildebrand made the sort of colossal blunder that will forever link him to the Jean Van de Veldes of the sporting world.
...
Hildebrand was faced with a choice when he came up on another rookie, Charlie Kimball, going much slower as they approached the fourth turn.
The prudent thing would’ve been to back off and tuck in behind Kimball until they were on the main straightaway. Then Hildebrand could’ve gone on by to take the checkered flag.
Instead, showing his inexperience, Hildebrand decided to stay on the gas and go around on the outside. That put him into “the marbles,” the tiny particles of rubber that gather near the wall, making that part of the track especially slick.
He never had a chance.
“Is it a move that I would do again?” Hildebrand said. “No.”

_______________

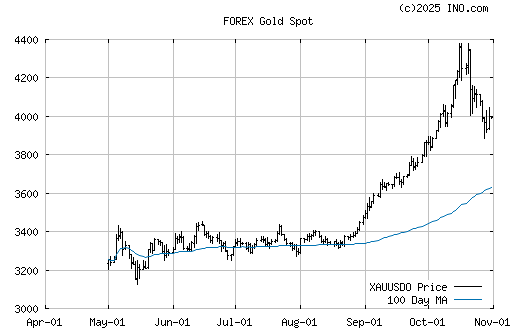
Similar analogies of experience, and weighing risk vs. returns can be made to investing and trading. We use computerized trading systems that take the emotions out of trading the financial markets. This keeps us disciplined and focused on idea generation and research.

Related info:
http://whowillwinthebiggame.blogspot.com/2011/05/indy-500-sport-psychology.html

Wednesday, May 11, 2011

Intermediate-Term Stock Indicators turn Bullish

Our intermediate-term oversold/overbought stock indicators are turning bullish at current stock market levels.  The S&P is currently at 1338 --- and was at 1336 at the last intermediate-term stock indicator change on April 25, 2011.  (Please see link below for last signal.)

http://z-trader.blogspot.com/2011/04/overbought-stock-indicators-42511-340pm.html

Our long-term indicators remain strongly bullish.

Friday, May 6, 2011

Gold

Gold -- Long-Term Chart

Gold Spot (FOREX:XAUUSDO)

Have these markets broken down?  Some notes:

  • Gold & crude were definitely extended.
  • Even in long-term trends, the markets can flip around the 100-day moving average.
  • Some would view the direction of the average; as well as "envelopes" or Bollinger Bands.

Crude Oil

Below is a current chart of the crude oil market (daily bars going back 6 months, so it is a relatively long-term chart).

CRUDE OIL Jun 2011 (E) (NYMEX:CL.M11.E)

Long-Term daily chart of the Crude Oil market (June 2011 contract) -- with 100-day moving average/  Thank you to INO for the chart.

Some folks would use technical analysis and look at:
  • General trends such as moving averages or momentum
  • Directional of various averages

Thursday, May 5, 2011

Volatile Commodities & Futures Markets

Just a quick report on the volatility in the commodities & futures markets.  Our risk management approaches got us out of oil and gold before the steep declines today.  On the other hand, the downdraft crept into many other markets (industrial metals, agriculturals, foreign currencies, US Dollar) -- and reversed long-standing trends in early May.  This caused us to give up much of the recent profits we have earned over the past several weeks.  Our Diversified Programs are down about -3.5% this month.

As reported by MarketWatch, commodities suffered their worst decline since 2009.  Please read more here:


REUTERS/JEFFERIES CRB INDEX (NYBOT:CR)

CRB Index Past 3 months (as of 5/5/11; see the last bar on the right...)
Thank you to INO.com for the chart.

***
Today alone, crude oil declined $10/barrel to below $100 and gold declined about $50/ounce to below $1500.  The Liquid Commodity Index reflected the recent volatility -- declining -5% today (May 5, 2011); and is down -8.6% for the month, after rising to new highs in April.   

We currently have relatively small positions, reflecting the reversals and volatility in the futures markets.  We will, of course, continue to "do what we do" -- and will follow our trading system/risk management strategies. (Unfortunately, this kind of market action is not unprecedented.)

Please let us know if you have any questions.